
Marketing metrics are quantifiable indicators that measure the effectiveness of your campaigns and guide every spending decision you make. The term "marketing metrics" covers everything from raw impressions to revenue return, but the industry standard for the most strategic subset is key performance indicators (KPIs). Understanding which numbers actually matter separates teams that grow from teams that guess. Tools like Google Analytics, HubSpot, and Campaign Monitor surface hundreds of data points daily. The real skill is knowing which ones to act on.
Marketing metrics explained: metrics vs. kpis
Metrics and KPIs are not the same thing. A metric is any quantitative measure you can track, such as page views, email opens, or ad impressions. A KPI is a metric specifically tied to a strategic business objective, like hitting a revenue target or reducing customer acquisition cost. Every KPI is a metric, but not every metric is a KPI.

This distinction matters because most marketing platforms generate far more data than any team can act on. Without a clear filter, you end up reporting on numbers that feel productive but drive no decisions.
The four levels of marketing metrics organize the data clearly:
- Exposure metrics: Impressions, reach, and share of voice. These measure how many people saw your message.
- Engagement metrics: Click-through rate (CTR), time on page, and social interactions. These measure how people responded.
- Conversion metrics: Lead volume, form completions, and trial sign-ups. These measure how many people took action.
- Value metrics: Customer Acquisition Cost (CAC), Return on Marketing Investment (ROMI), and customer lifetime value. These measure business impact.
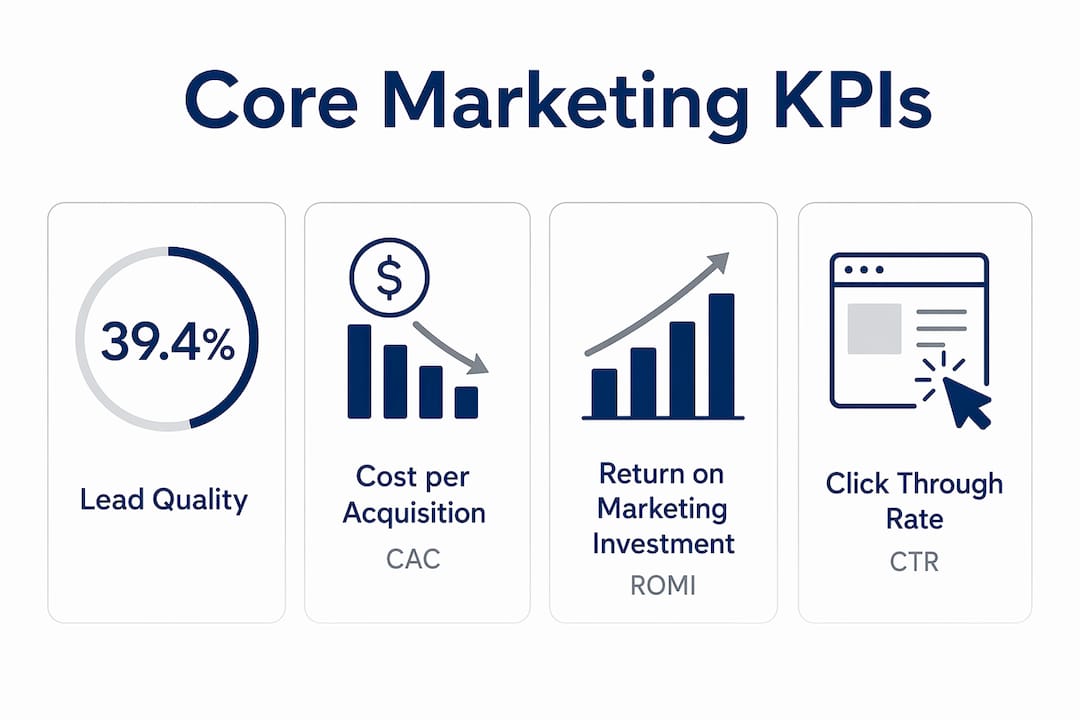
According to HubSpot's 2026 performance data, the top three KPIs marketers prioritize are lead quality at 39.4%, conversion rates at 33.9%, and ROMI at 31.1%. Those numbers confirm that high-performing teams have already moved past exposure and engagement. They are focused on revenue.
Pro Tip: Before selecting your KPIs, write down the one business outcome your marketing must deliver this quarter. Every metric you track should connect directly to that outcome. If it does not, remove it from your dashboard.
| Metric Type | Example | Business Question It Answers |
|---|---|---|
| Exposure | Impressions | Are enough people seeing our brand? |
| Engagement | Click-through rate | Are people interested in what we say? |
| Conversion | Lead volume | Are we generating pipeline? |
| Value | ROMI, CAC | Is marketing generating profitable growth? |
How do marketing dashboards improve decision-making?
A marketing dashboard is a unified visual interface that consolidates your core KPIs into one view for real-time monitoring. Dashboards aggregate KPIs across funnel stages, giving you a single source of truth instead of scattered reports from Google Analytics, your CRM, and your ad platforms.
High-performing teams monitor 8–12 core KPIs rather than tracking every available metric. That range is deliberate. Fewer than eight KPIs often misses critical blind spots. More than twelve creates noise that slows decisions.
A well-built dashboard spans the full funnel. Here is how to structure it:
- Awareness layer: Track impressions, organic reach, and branded search volume to confirm your message is getting out.
- Engagement layer: Monitor CTR, bounce rate, and session duration to evaluate content quality and audience fit.
- Pipeline layer: Measure marketing-qualified leads (MQLs), cost per lead, and marketing-influenced pipeline to connect campaigns to sales opportunities.
- Revenue layer: Report CAC, ROMI, and Return on Ad Spend (ROAS) to show the financial return on every dollar spent.
The practical value of a dashboard is speed. When a campaign underperforms, you see it in real time and reallocate budget before the month ends. Without a consolidated view, that same problem might surface three weeks later in a spreadsheet review. For small businesses especially, that delay is expensive.
Pro Tip: Set a weekly 15-minute dashboard review on your calendar. Consistency matters more than depth. A quick weekly check catches problems early; a monthly deep-dive often catches them too late.
What are vanity metrics and why do they mislead?
Vanity metrics are measurements that look impressive but do not connect to business outcomes or inform specific decisions. Website traffic and social media likes are the most common examples. A post with 10,000 likes that generates zero leads has delivered no marketing value.
An actionable metric directly informs a specific operational or strategic decision. A vanity metric has no pre-defined response. When your follower count goes up, what do you do differently? Usually nothing. When your cost per MQL rises 40% in a week, you investigate targeting, ad creative, and landing page performance immediately.
Attribution errors compound the vanity metric problem. Most ad platforms, including Google Ads and Meta Ads Manager, report conversions using last-click or platform-specific attribution models. Platform analytics frequently over-credit their own channels, which inflates reported performance and leads to budget decisions based on correlation rather than causation.
The most common attribution traps to avoid:
- Last-click bias: Crediting only the final touchpoint ignores every earlier interaction that built intent.
- Double counting: When multiple platforms claim the same conversion, your total reported conversions exceed actual sales.
- Platform self-reporting: Google reports Google's impact. Meta reports Meta's impact. Neither has an incentive to show you where their channel underperformed.
Incrementality testing is the gold standard for causal proof of marketing impact. It works by splitting your audience into a test group that sees your campaign and a control group that does not. The difference in conversion rates between the two groups is the true lift your campaign created. This method removes the noise from platform-reported data and shows you what your marketing actually caused.
Pro Tip: Run an incrementality test on your highest-spend channel before your next budget review. The results often reveal that 20–30% of reported conversions would have happened anyway, which changes the ROI calculation significantly.
"The difference between correlation and causation in marketing data is the difference between spending confidently and spending blindly." — Measuring Marketing Performance in 2026
How to apply metrics to improve campaign performance
Applying marketing analytics effectively requires connecting every metric you track to a specific business outcome. Measurement without purpose produces reports. Measurement with purpose produces growth.
Follow these steps to build a metrics-driven campaign process:
- Define the objective first. State the business outcome before you launch. "Generate 50 qualified leads at a CAC under $150" is a measurable objective. "Increase brand awareness" is not.
- Select three to five KPIs per campaign. Use the four-level framework from earlier: one exposure metric, one engagement metric, one conversion metric, and one value metric. Keep it tight.
- Establish baselines before launch. Know your current CTR, conversion rate, and CAC before you change anything. Without a baseline, you cannot measure improvement.
- Test one variable at a time. Change the CTA, the audience segment, or the ad creative. Never change all three simultaneously. You need to know which variable drove the result.
- Review and adjust on a fixed schedule. Weekly for paid campaigns. Bi-weekly for content and email. Monthly for overall channel performance.
CAC and ROMI are the two financial KPIs that connect marketing directly to profitability. CAC tells you what you paid to acquire each new customer. ROMI tells you how much revenue each marketing dollar returned. Together, they answer the question every business owner actually cares about: is this working?
| KPI | Formula | What It Tells You |
|---|---|---|
| CAC | Total marketing spend / New customers acquired | Cost efficiency of acquisition |
| ROMI | (Revenue from marketing / Marketing spend) x 100 | Revenue return per dollar spent |
| CTR | Clicks / Impressions x 100 | Ad and content relevance |
| Conversion Rate | Conversions / Total visitors x 100 | Landing page and offer effectiveness |
For SMB marketing strategies, the most common mistake is optimizing for CTR while ignoring conversion rate. A 5% CTR means nothing if only 1% of those clicks convert. Always trace the full path from impression to revenue before declaring a campaign successful.
Understanding your marketing funnel performance at each stage also reveals where leads drop off, which tells you exactly where to focus optimization efforts next.
Key takeaways
The most effective approach to marketing metrics is selecting 8–12 KPIs tied directly to revenue, testing for causal impact, and reviewing performance on a fixed schedule.
| Point | Details |
|---|---|
| Metrics vs. KPIs | KPIs are metrics linked to strategic objectives; not every metric deserves dashboard space. |
| Dashboard focus | Monitor 8–12 core KPIs spanning exposure, engagement, pipeline, and revenue for clear decisions. |
| Avoid vanity metrics | Prioritize actionable metrics like CAC and ROMI over traffic and likes that inform no decision. |
| Attribution accuracy | Use incrementality testing with control groups to find true campaign lift, not platform-reported correlation. |
| Apply metrics to outcomes | Define a measurable objective first, then select KPIs that connect directly to that business result. |
What most businesses get wrong about metrics
I have worked with dozens of small businesses that came to us drowning in data and starving for direction. The pattern is almost always the same. Someone set up Google Analytics, connected it to a dashboard, and started reporting on 40 metrics every month. The reports looked thorough. The business did not grow.
The problem is not a lack of data. The problem is treating measurement as a reporting exercise instead of a decision-making tool. When I ask a business owner what they did differently because of last month's report, the answer is usually silence.
The shift that actually produces results is small. Pick three metrics that connect directly to revenue. Review them weekly. Ask one question each time: what does this number tell me to do differently? That discipline, repeated consistently, compounds into real growth over months.
I also see a lot of misplaced trust in platform data. Google and Meta both report impressive numbers. Those numbers are real, but they are not the whole story. Running even a basic incrementality test once a year will change how you allocate budget. The results are almost always surprising, and almost always save money.
The businesses that win with metrics are not the ones with the most sophisticated tools. They are the ones that stay focused, test honestly, and act on what they find.
— Tran
How Sourcesnova helps you measure what matters
Sourcesnova was built for businesses that are tired of paying for marketing they cannot measure. Too many agencies hand over monthly reports full of impressions and follower counts while revenue stays flat. Sourcesnova takes a different approach.
Sourcesnova works with local and small-to-mid-size businesses to build clear measurement frameworks, identify the KPIs that actually connect to growth, and execute campaigns with real accountability. No vanity reports. No jargon. Just a clear picture of what is working and what to do next. If you are ready to stop guessing and start measuring with purpose, visit Sourcesnova to see how the team can help you build a marketing program that proves its own value.
FAQ
What are marketing metrics?
Marketing metrics are quantifiable measures used to track and evaluate the performance of marketing campaigns and activities. They range from exposure data like impressions to financial indicators like ROMI and CAC.
What is the difference between a metric and a KPI?
A metric is any measurable data point, while a KPI is a metric tied to a specific strategic business objective. Every KPI is a metric, but most metrics are not KPIs.
What are vanity metrics in marketing?
Vanity metrics are measurements like social media likes and raw website traffic that look positive but do not connect to revenue or inform specific decisions. Actionable metrics like conversion rate and CAC are more useful.
How many kpis should a marketing dashboard track?
High-performing teams track 8–12 core KPIs on their dashboards, focusing on quality and revenue impact rather than volume of data points.
What is incrementality testing in marketing?
Incrementality testing splits an audience into a test group and a control group to measure the true lift a campaign creates. It provides causal proof of marketing impact rather than relying on platform-reported correlation data.