
Marketing ROI, formally called Return on Marketing Investment (ROMI), measures the revenue generated for every dollar spent on marketing. The core formula is straightforward: Marketing ROI = (Revenue from campaign − Marketing cost) / Marketing cost × 100. A result of 500% means you returned $5 for every $1 spent. According to Investopedia, a 5:1 ratio is generally considered strong, 10:1 exceptional, and 2:1 often insufficient to cover overhead and margin in many industries.
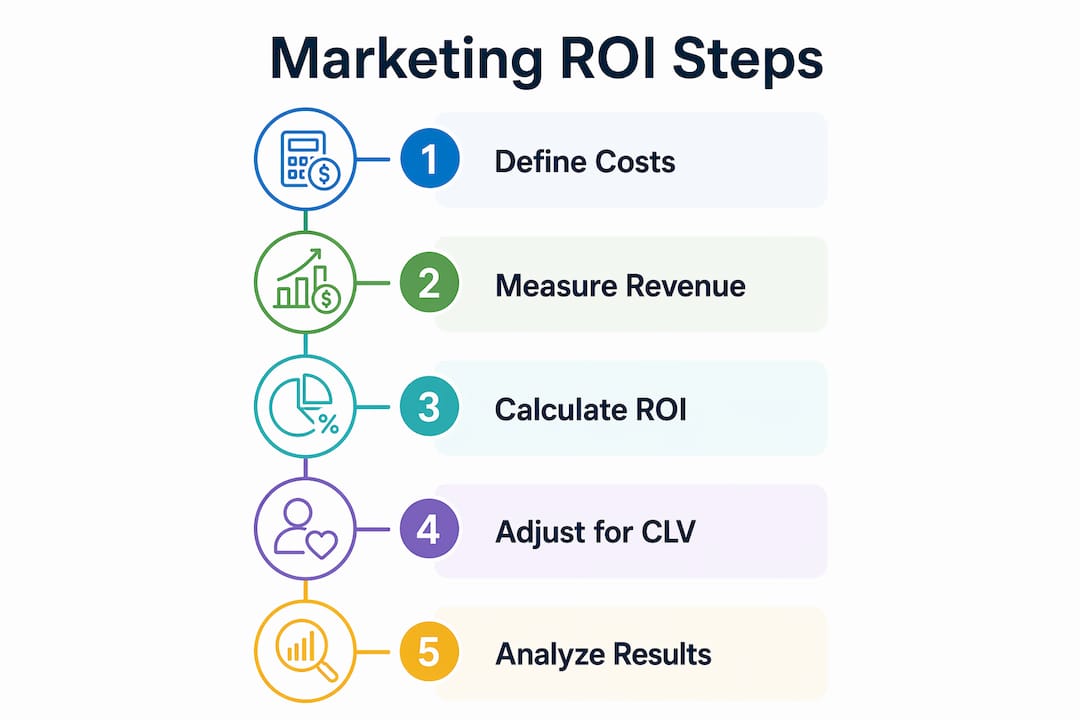
Table of Contents
- Why does marketing ROI matter to business leaders?
- What are the main formulas for calculating marketing ROI?
- How to calculate marketing ROI: two worked examples
- Which costs belong in your marketing cost figure?
- What are the biggest attribution challenges in measuring ROI?
- How does customer lifetime value change your ROI calculation?
- How can you improve marketing ROI? A practical checklist
- Key Takeaways
- The practitioner's perspective on reporting ROI to leadership
- Useful sources and further reading
Why does marketing ROI matter to business leaders?
Marketing spend is classified as an operating expense, meaning it hits the income statement immediately rather than being capitalized over time. That accounting reality creates direct pressure: leadership wants to see returns in the same period the money goes out. ROI gives marketing a common language with finance, translating campaign results into dollar terms that executives already understand and trust.
Beyond the finance conversation, ROI drives three specific decisions:
- Budget allocation: When two channels compete for the same dollars, the one with a higher ROI wins the argument, assuming the data is clean.
- Campaign continuation: A campaign running below a 2:1 ratio signals a need to pause, test, or reallocate before more spend compounds the loss.
- Channel scaling: A channel consistently hitting 5:1 or above is a candidate for increased investment, provided incrementality has been verified (more on that in the attribution section).
ROI also moves reporting beyond soft engagement metrics like impressions and click-through rates. Those numbers describe activity; ROI describes outcomes. That shift in framing changes how marketing is perceived at the executive level.
What are the main formulas for calculating marketing ROI?
Not every campaign calls for the same formula. The right choice depends on what data you have and what decision you are trying to support.

| Formula | Calculation | Required Inputs | Best Used For |
|---|---|---|---|
| Basic ROI | (Revenue − Cost) / Cost × 100 | Campaign revenue, total marketing cost | Quick campaign-level checks |
| ROMI (contribution-margin) | (Revenue × Margin% − Cost) / Cost × 100 | Revenue, gross margin %, marketing cost | Executive reporting, P&L alignment |
| Incremental ROI | (Sales growth − Organic growth − Cost) / Cost × 100 | Campaign sales, baseline organic sales, cost | Proving net marketing effect |
| CLV-based ROI | (New customers × CLV − Cost) / Cost × 100 | Customer count, CLV estimate, marketing cost | Brand, content, and retention investments |
The basic ROI formula from NetSuite is the starting point: (Gain from investment − Cost of investment) / Cost of investment × 100. It is fast and universally understood, but it overstates returns when organic sales would have occurred anyway.
Contribution-margin ROMI corrects for that by multiplying revenue by the gross margin percentage before subtracting cost. If your margin is 40% and your campaign generated $100,000 in revenue at a cost of $20,000, the ROMI is ($100,000 × 0.40 − $20,000) / $20,000 = 100%, not 400%. That distinction matters when you are presenting to a CFO who thinks in margin, not gross revenue.
Incremental ROI subtracts the organic baseline, giving leadership a cleaner read on what marketing actually caused. CLV-based ROI is the right tool when a campaign's value plays out over months or years rather than a single purchase.
How to calculate marketing ROI: two worked examples
Example 1: Simple campaign ROI
A paid search campaign for a retail client runs for 30 days. Here is the step-by-step calculation:
- Total campaign revenue attributed: $45,000
- Total marketing cost (ad spend + agency fee + creative): $9,000
- Apply the formula: ($45,000 − $9,000) / $9,000 × 100
- Result: 400% ROI, or a 4:1 ratio
That result falls below the 5:1 benchmark for a strong return, which makes it a candidate for creative testing or bid optimization before scaling.
Example 2: CLV-adjusted ROI
A local service business runs a lead generation campaign and acquires 25 new customers at a total cost of $5,000. Each customer has an estimated CLV of $800 over two years.
- Total CLV from campaign: 25 × $800 = $20,000
- Marketing cost: $5,000
- Apply the formula: ($20,000 − $5,000) / $5,000 × 100
- Result: 300% ROI on a CLV basis
Without the CLV adjustment, the same campaign might look like a loss if first-purchase revenue averaged only $150 per customer ($3,750 total versus $5,000 spent). Substituting CLV for single-purchase revenue turns a misleading negative into a justified investment.
Common calculation errors to avoid: Counting gross revenue instead of contribution margin; omitting agency fees, creative costs, or software subscriptions from the cost base; failing to subtract organic baseline sales; and using a CLV estimate that assumes 100% retention.
Which costs belong in your marketing cost figure?
The cost variable is where most ROI calculations go wrong. Undercounting costs inflates returns and leads to bad scaling decisions. Every line item that exists because of the campaign belongs in the denominator.
Direct costs to include:
- Ad spend (paid search, paid social, display, programmatic)
- Creative production (design, video, copywriting)
- Agency or freelancer fees
- Marketing software and analytics subscriptions (CRM, attribution tools, email platforms)
- Allocated staff time for campaign management
Indirect costs often missed:
- Fulfillment or shipping costs tied to campaign-driven orders
- Customer service overhead from campaign-generated volume
- Landing page development or CMS costs
| Time Horizon | Campaign Type | Why It Matters |
|---|---|---|
| 30 days | Performance ads (paid search, paid social) | Short conversion cycles; ROI is measurable quickly |
| 6 months | Content marketing, SEO | Organic traffic builds over time; early ROI understates value |
| 12 months | Brand campaigns, CLV investments | Revenue accrues through repeat purchases and referrals |
Pro Tip: When a team member splits time across multiple campaigns, allocate their cost proportionally by hours logged per campaign. Leaving shared labor out of the cost base is the single most common reason ROI looks better on paper than it performs in practice.
What are the biggest attribution challenges in measuring ROI?
Attribution is where accurate ROI measurement gets difficult. The core problem: most customers interact with multiple touchpoints before converting, and the model you choose to assign credit determines the ROI each channel receives.
- Single-touch attribution (first-click or last-click) assigns 100% of the conversion value to one touchpoint. It is simple but systematically over-credits one channel and under-credits others.
- Multi-touch attribution distributes credit across the customer journey using rules (linear, time-decay, position-based) or data-driven models. It is more accurate but requires clean, connected data across channels.
- Incrementality testing asks a different question entirely: would this customer have converted without the marketing? Holdout experiments, where a control group receives no ads, answer that question directly.
Common data-quality issues that bias ROI calculations include cookie loss from browser privacy changes, cross-device journeys that break tracking, and delayed conversions that fall outside the reporting window. Reliable attribution requires clean data pipelines, consistent UTM tagging, and ideally server-side tracking to reduce cookie dependency.
Practical mitigations:
- Implement UTM parameters on every paid and owned link, without exception.
- Use server-side tagging to reduce data loss from browser-level blocking.
- Run geo-based or audience holdout tests for high-spend channels to validate incrementality.
- Consider modeled attribution (such as Google's data-driven model) when cross-device journeys are common.
Pro Tip: If a channel accounts for more than 20% of your total marketing budget, it warrants a dedicated incrementality test before you scale. Correlation between spend and revenue is not causation, and the difference can be significant.
How does customer lifetime value change your ROI calculation?
CLV is the total contribution margin a customer generates over their entire relationship with your business. Using it instead of single-purchase revenue gives a more accurate picture of what acquiring a customer is actually worth.

A practical CLV formula: CLV = Average Order Value × Purchase Frequency × Retention Period × Contribution Margin %
For example: $120 AOV × 3 purchases per year × 2 years × 40% margin = $288 CLV per customer.
Alongside CLV, tracking complementary metrics like customer acquisition cost (CAC) and channel-level conversion rates gives a fuller picture of where marketing investment is generating durable returns.
Small changes in retention have an outsized effect on CLV. Improving annual retention from 60% to 70% on a two-year model increases the retention period and can lift CLV by 25% or more, which directly improves the ROI of any acquisition campaign. That sensitivity is why retention-focused tactics, such as email sequences and loyalty programs, often deliver stronger long-term ROI than pure acquisition spend. Winning email marketing strategies that drive repeat purchases are one of the highest-leverage levers available to small and mid-size businesses.
How can you improve marketing ROI? A practical checklist
Improving ROI requires action on both the revenue side and the cost side simultaneously. Work through these steps in order of impact:
- Tighten audience targeting. Narrow your paid audiences to the segments with the highest historical conversion rates. Broad targeting wastes spend on low-intent users.
- Raise conversion rates before scaling spend. A landing page converting at 4% instead of 2% doubles revenue without touching the ad budget. Test headlines, offers, and form length.
- Eliminate wasted spend. Audit search term reports, placement reports, and audience overlap weekly. Negative keywords and placement exclusions are free efficiency gains.
- Increase average order value. Upsell and cross-sell at checkout. A 10% lift in AOV improves ROI on every acquisition campaign without additional spend.
- Improve attribution discipline. Audit UTM coverage monthly. Every untagged link is a revenue attribution gap that makes ROI look worse than it is.
- Standardize ROI reporting. Use contribution margin, not gross revenue, in every report you send to leadership. Include an incrementality note explaining what the organic baseline was.
- Test creative systematically. Run A/B tests on ad creative and landing pages with statistically meaningful sample sizes before declaring a winner.
Pro Tip: Start with conversion rate optimization before increasing ad spend. A $500 investment in landing page testing often returns more than $5,000 in additional ad budget on a campaign that is already converting poorly.
For lead generation campaigns specifically, reducing cost per lead through better targeting and creative testing has a compounding effect on ROI that scales with every additional dollar spent.
Key Takeaways
Marketing ROI is most reliable when it uses contribution margin, subtracts organic baseline sales, and accounts for CLV on campaigns where customer value accrues over time.
| Point | Details |
|---|---|
| Use the right formula | Basic ROI for quick checks; contribution-margin ROMI for finance reporting; CLV-based ROI for retention investments. |
| Include all costs | Ad spend, creative, agency fees, software, and allocated staff time all belong in the cost base. |
| Subtract the organic baseline | Incremental ROI removes baseline sales growth so leadership sees the net effect of marketing. |
| Apply CLV for long-term campaigns | Multiplying new customers by CLV prevents short-term losses from masking strong long-term returns. |
| Use benchmarks as context | A 5:1 ratio is strong and 10:1 is exceptional per Investopedia; always contextualize against your margin and growth stage. |
The practitioner's perspective on reporting ROI to leadership
The most common mistake Sourcesnova sees in client reporting is treating ROI as a single number rather than a conversation. A 300% ROI on a brand awareness campaign and a 300% ROI on a direct-response paid search campaign are not the same thing. The inputs, time horizons, and confidence levels differ significantly, and presenting them identically misleads the people making budget decisions.
For small businesses, the 5:1 benchmark is a useful starting point, but margin structure matters more. A business running at 25% gross margin needs a higher revenue-to-spend ratio to hit the same profit return as one running at 60% margin. Benchmarks are conversation starters, not verdicts.
When preparing a client-ready ROI report, Sourcesnova recommends this checklist:
- State the formula used and whether it is gross-revenue or contribution-margin based.
- Show the organic baseline and explain how it was estimated.
- Include a CLV assumption with the source and the sensitivity range.
- Present incrementality evidence, even if it is a simple before/after comparison with a caveat.
- Recommend a next step: scale, test, pause, or reallocate.
The goal is not to defend a number. It is to give leadership the context to make a better decision with the next dollar. That is what separates a data-driven marketing practice from one that reports activity and hopes for credit.
Useful sources and further reading
The following sources were used throughout this article and are worth bookmarking for deeper study:
- Investopedia: Measuring Marketing ROI — Covers benchmarks, incremental ROI, and the cost inputs practitioners often miss.
- NetSuite: Marketing ROI — Solid reference for the canonical formula and attribution measurement guidance.
- Wikipedia: Return on Marketing Investment — Useful for the ROMI contribution-margin formula and the OPEX accounting context.
- Shopify: What Is Marketing ROI? — Practical guidance on pairing ROI with CLV, CAC, and conversion metrics.
- Amazon Ads: Marketing ROI Formula and Examples — Good framing for moving beyond engagement metrics to financial returns.
- Sourcesnova: Marketing Metrics Explained — Sourcesnova's own guide to KPIs and how they connect to ROI reporting.
- Gatherpackaging: Elevate Your Marketing Strategy with Packaging — Useful for retail and product businesses looking at how presentation affects conversion and perceived value.